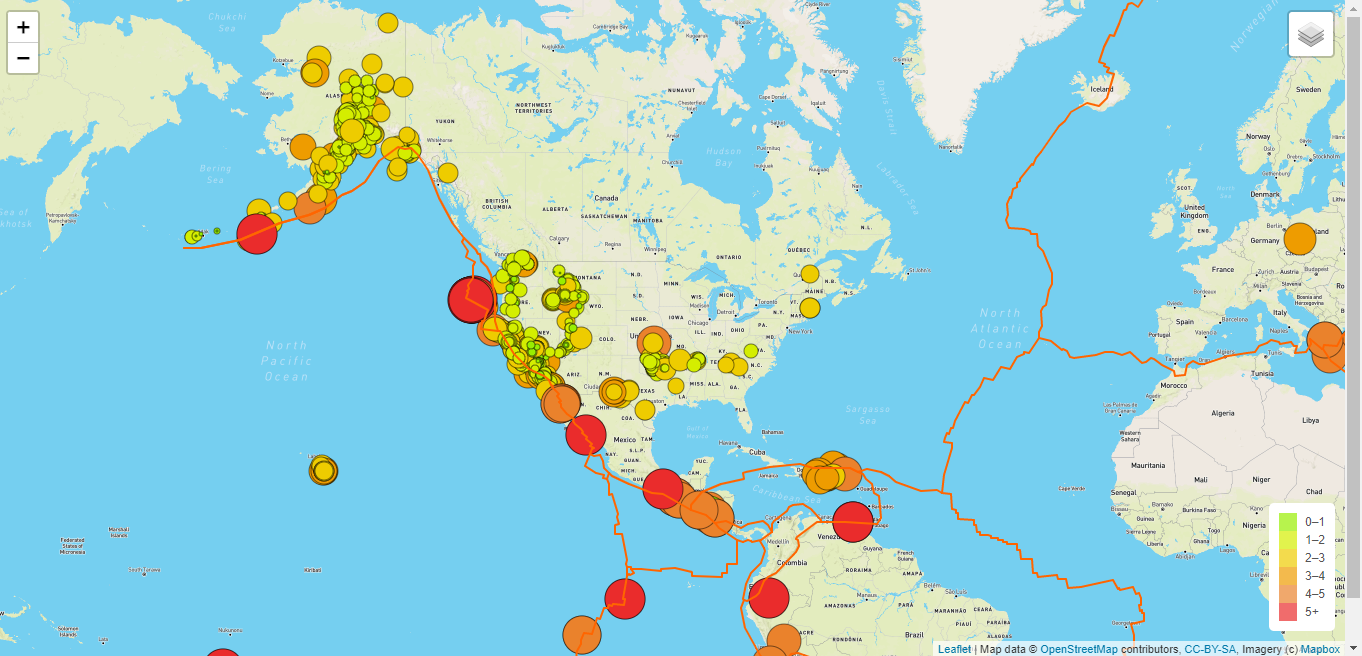
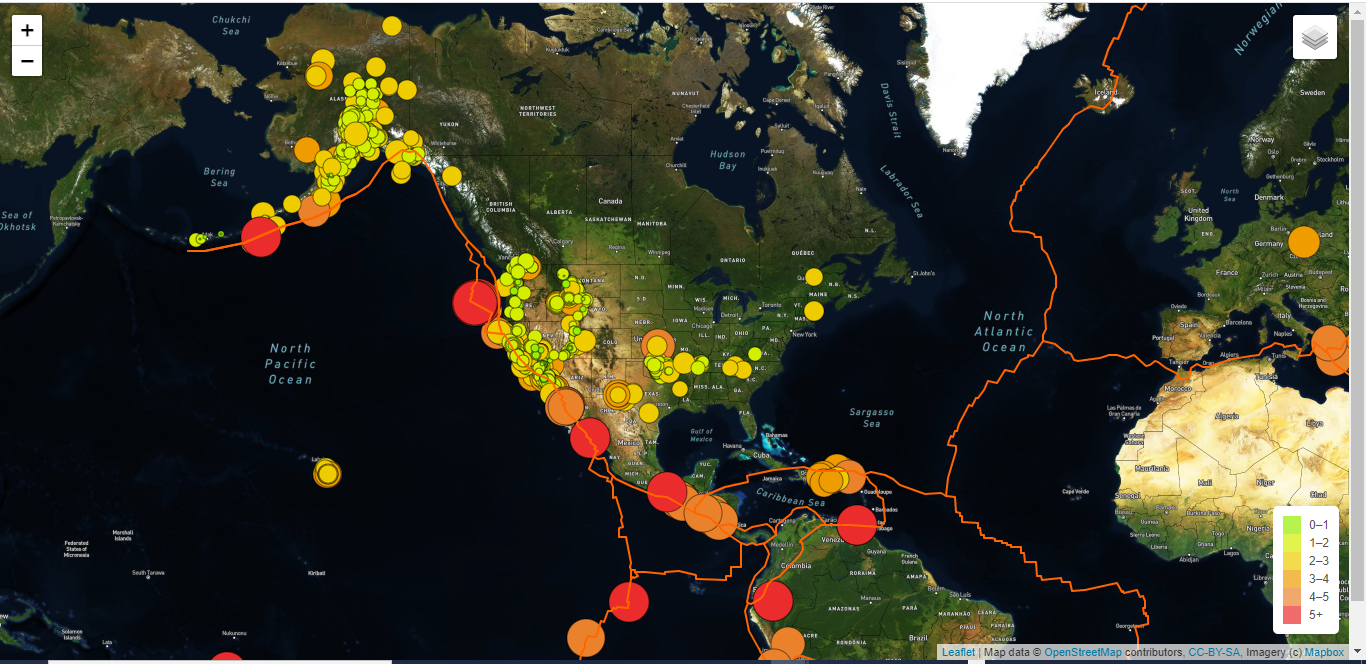
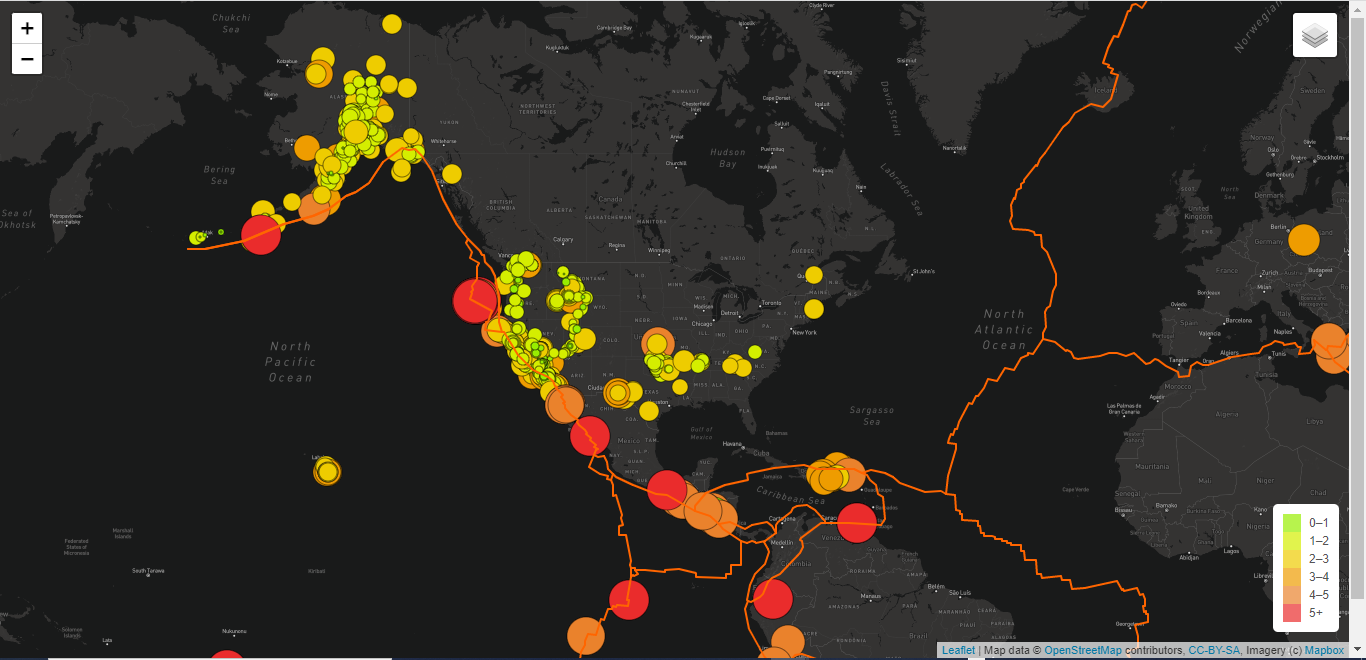
The purpose of this analysis was to continue utilizing my skills to use Javascript to read JSON data, Leaflet to display a map visualization, and HTML to successfully load the map into my browser. I added additional code to create three more maps to detect 1. tectonic plate locations 2. earthquakes with a magnitude higher than 4.5 and 3. adding an additional layer to include a dark colored map.